





Business Intelligence (BI)
PostHog's business intelligence (BI) capabilities let product and data teams dig into their data. With integrated BI tools, teams can create interactive dashboards, perform ad-hoc analyses, and visualize key metrics to drive informed decision-making.
Note: Looking for product analytics insights like timeseries trends and product usage funnels? You're in the wrong place. Check out Product analytics.
Note: PostHog business intelligence is in beta. It covers many BI use cases today, including some advanced features, and we add more all the time.
For deeper analysis, use Notebooks, which cover most industry use cases. You can also connect your favorite BI tooling, such as Hex, directly to your PostHog Trino warehouse.
Features
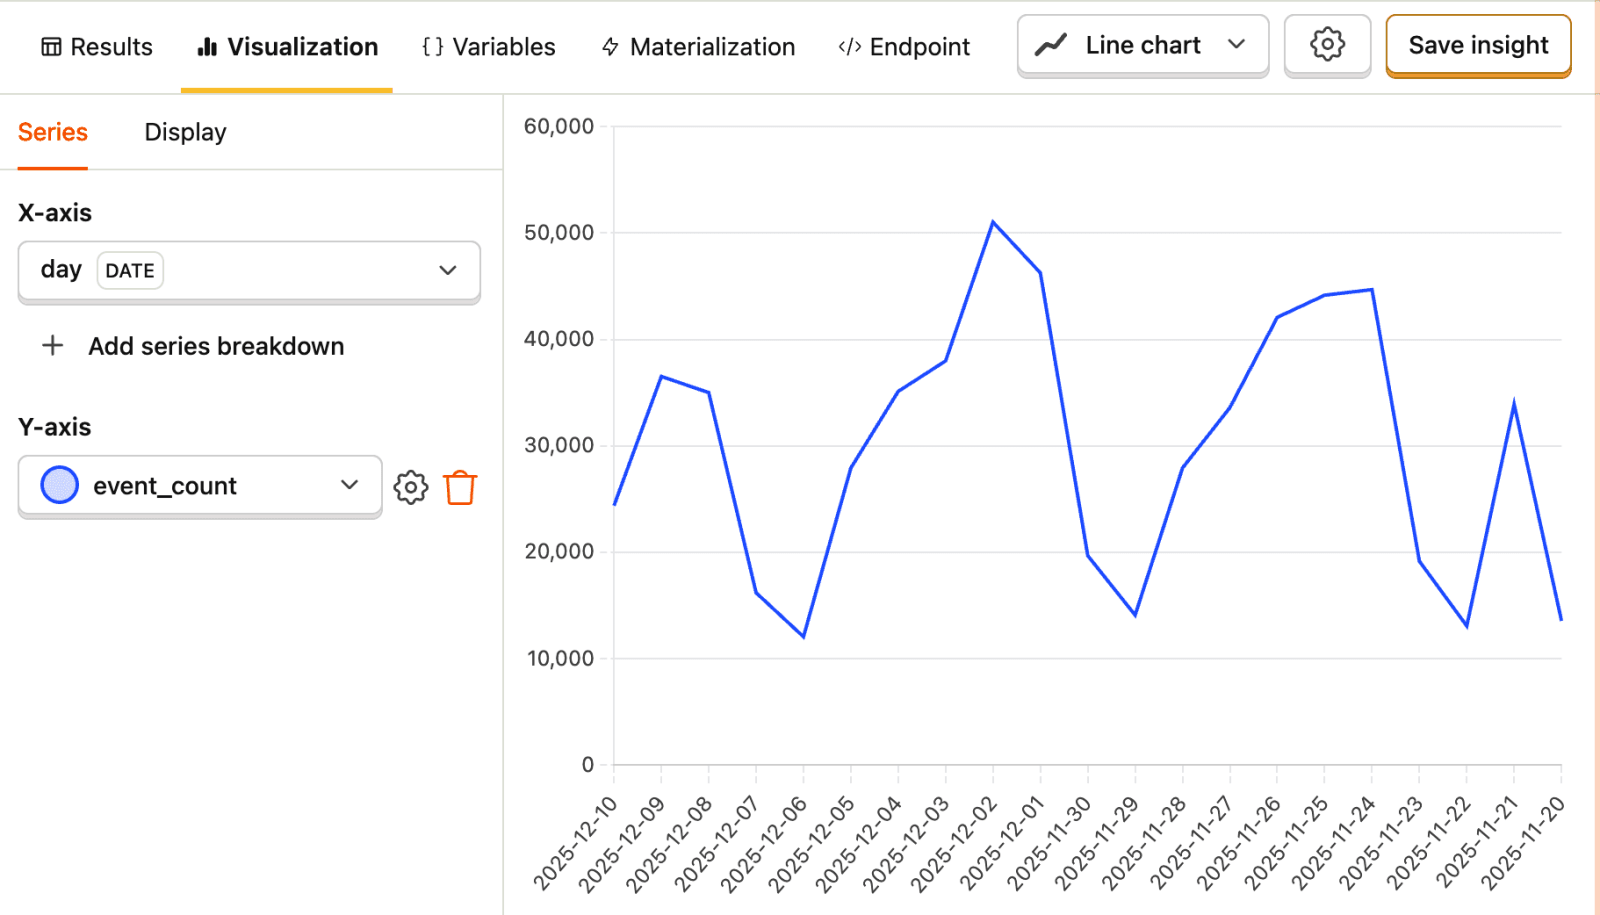
You can also visualize your warehouse data with our product analytics insights.